Hello, I am Nguyen. Welcome to truestar’s blog. Today, I would like to introduce to you how to diagnose Multicollinearity in Exploratory – a tool we have been using recently.
What is Multicollinearity
Firstly, we need to understand what correlation and multicollinearity are. In statistics, correlation is a measurement of the relationship between two variables. In other words, it indicates how the two variables move together in either the same or opposite direction. Secondly, multicollinearity is a situation where two or more predictors (so-called independent variables) are highly correlated. This phenomenon exists in regression analysis and often produce inaccurate or misleading forecast results. Therefore, it is important to detect multicollinearity to prevent your regression analysis from being problematic.
Diagnosing multicollinearity in Exploratory
Data used in this blog is an open dataset of
houses’ price downloaded from Kaggle:
Now, I am going to show you how to diagnose
multicollinearity with Exploratory in only 2 simple steps:
Step 1: read the dataset into
Exploratory. In this dataset, the forecast value (so-called dependent variable)
is Price, along with 16 independent variables.
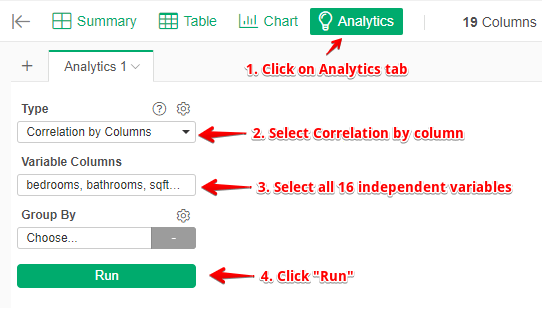
Step 2: execute the following actions:
Understanding Results
After clicking the “run” button, Exploratory will give us these results:
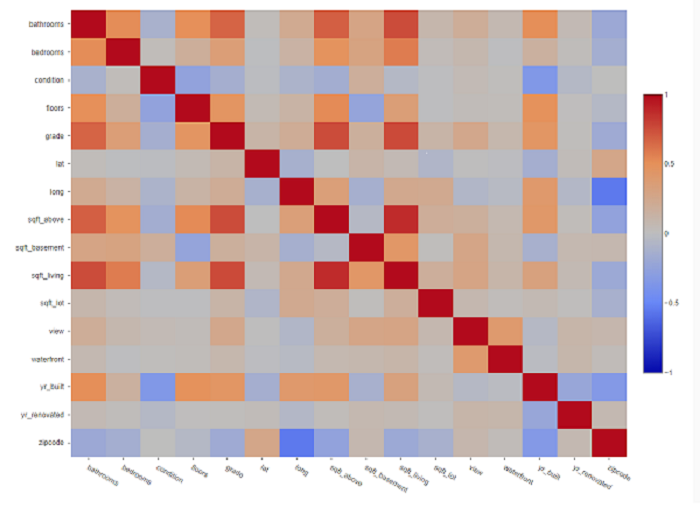
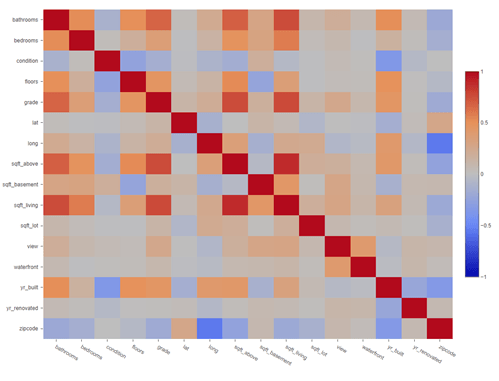
Correlations: a heatmap chart showing correlated pairwise comparison among variables with color density from -1 to 1. The red cells indicate positive correlations and the blue cells indicate negative correlations. The darker the two colors are, the higher the correlation is.
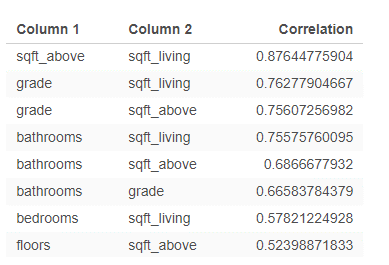
Positive Pairs: shows pairs which have positive correlation coefficient values.
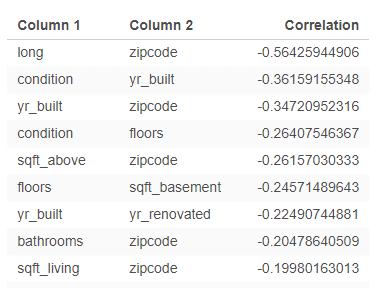
Negative Pairs: shows pairs which have negative correlation coefficient values.
In order to detect multicollinearity in regression analysis, it is suggested that the absolute value of correlation coefficient among independent variables – |r| should not approach and exceed 0.7.
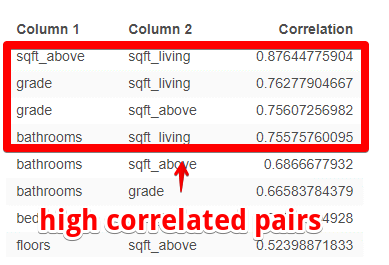
With positive and negative r-value tables above, we can immediately determine high correlations as in the red frame below:
You can clearly see that sqft_living and sqft_above are high correlated with others variables which is logically understandable. Then, we should remove these two in regression model for better forecast results.
For more details of correlation analysis in Exploratory, you can refer to this link:
Conducting statistical analysis with Exploratory, I think, is extremely simple and fast. Moreover, there are many more things you can do with Exploratory such as data cleansing, data analysis, machine learning, and data visualization which we will discuss in the next sections.