Tableau-ID TableauShow Latest Sales Ranking in Tableau

Showing the latest Sales figures ranking side by side your line graph seems to be very simple in Tableau. However, it is a little bit tricky if you don’t fully understand the relation of the dimentions’ filters in Tableau. Let me show you two ways to make it works.
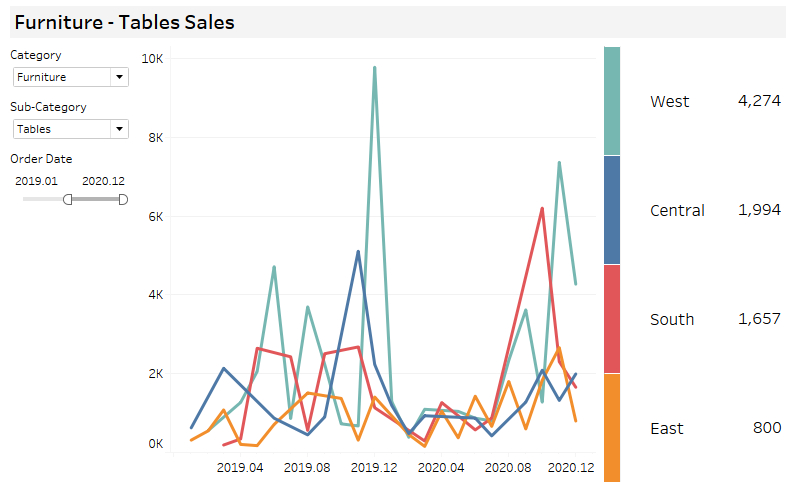
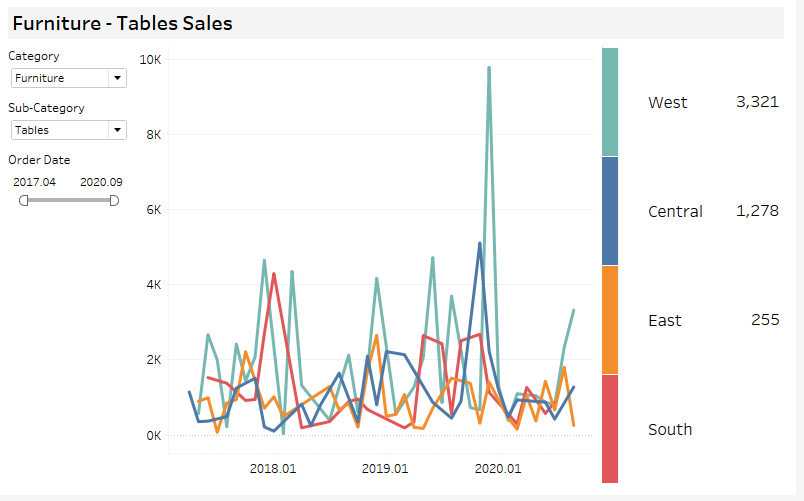
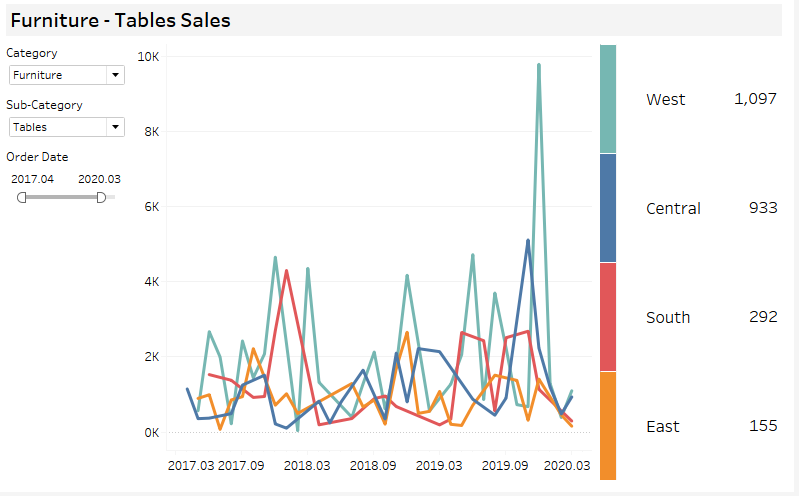
Desired output: a line graph with the latest Sales figures on the right like below. The ranking on the right side always show the latest sales depending on the change of the date filter.
Data source used: Sample – Super store

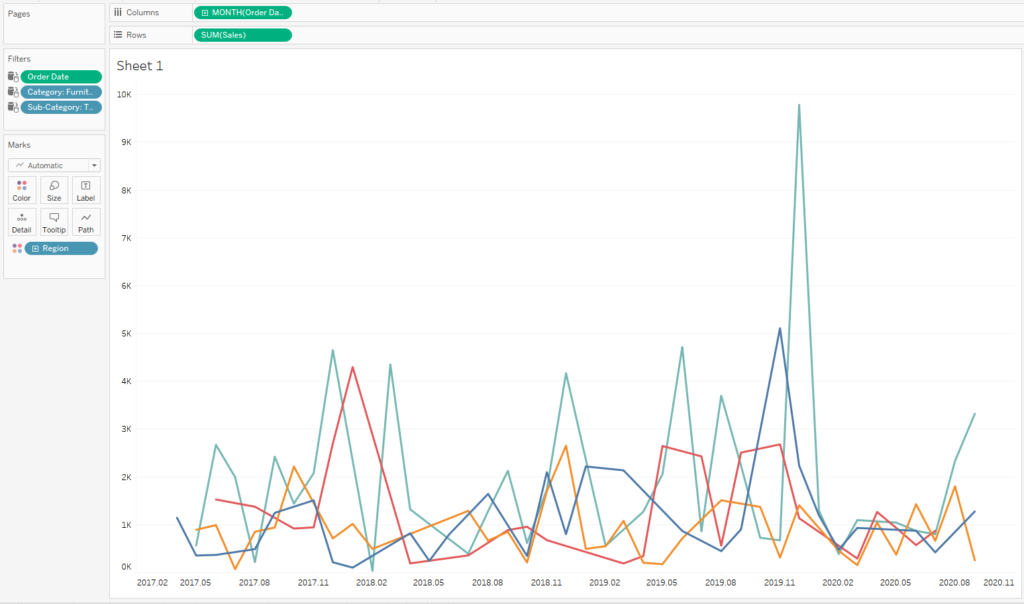
Firstly, create a line graph showing sales of each region by corlor, filtering by Category and Sub category.
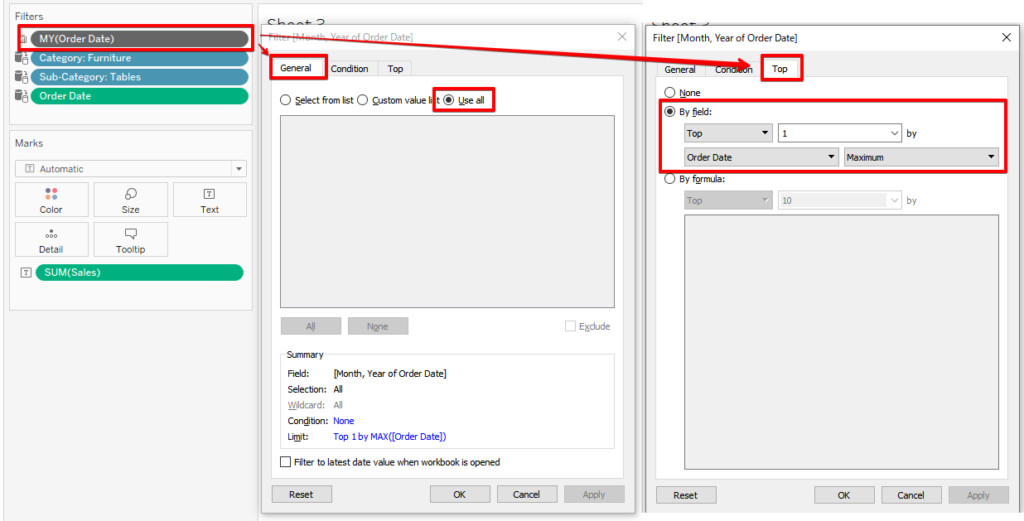
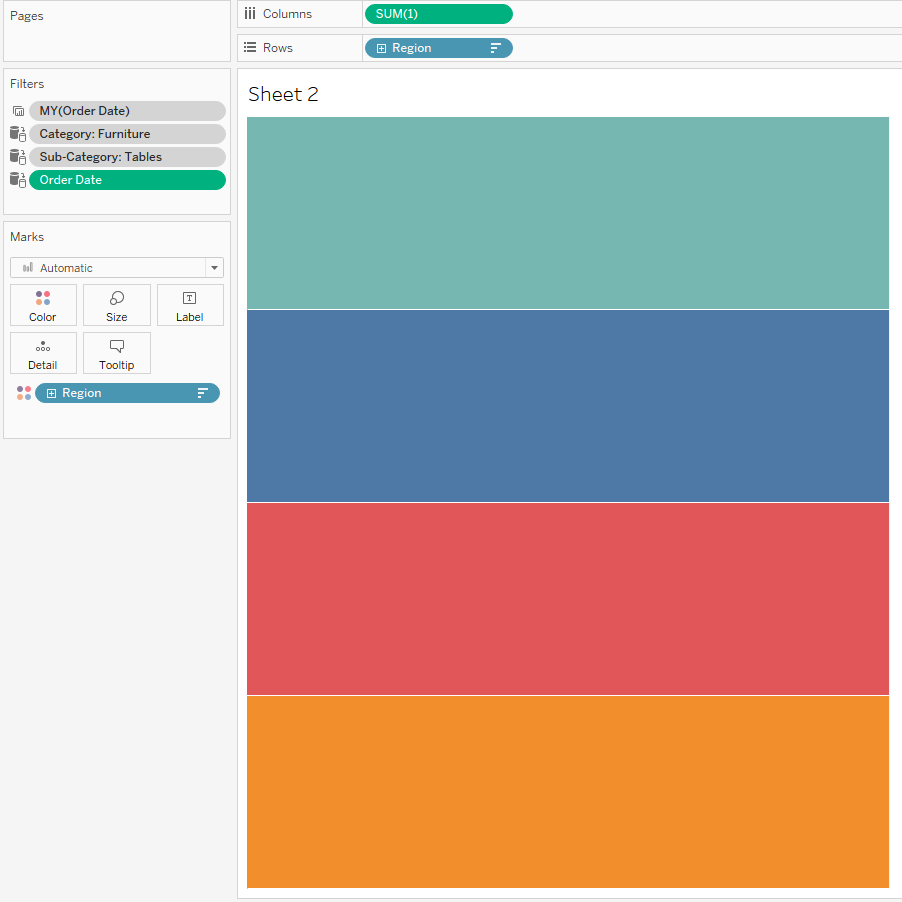
After building the line graph, add a new sheet, drag Order Date into Filter, set it the same as the capture below in both Gengeral and Top card : l
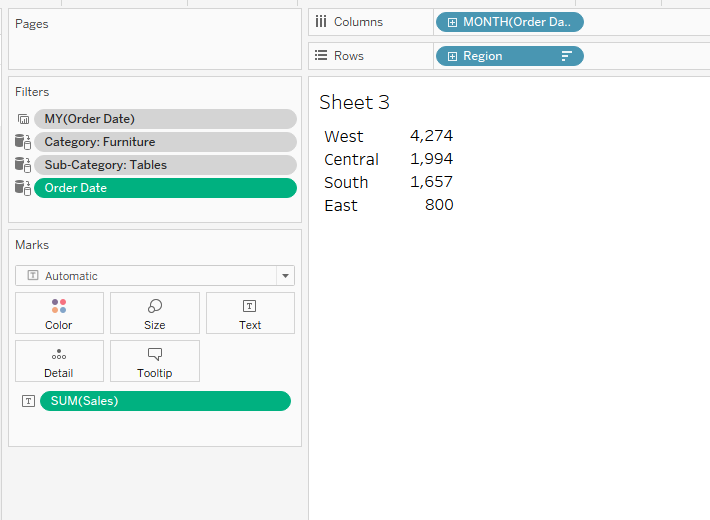
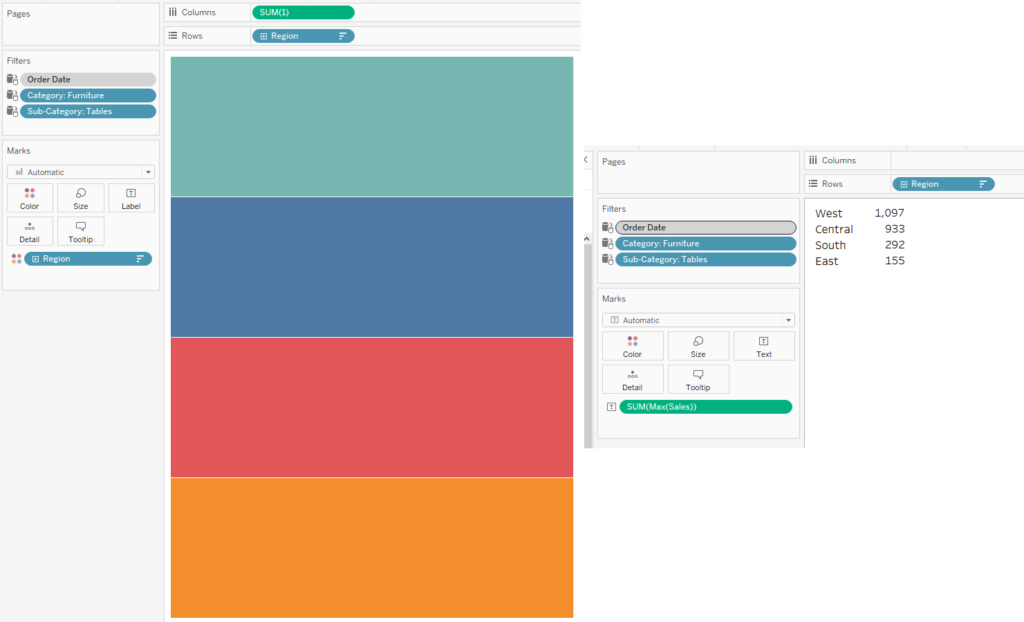
Then you can build latest sales ranking color block and score sheets, descending sorted by Sum(Sales) as well as a complete dashboard, like this

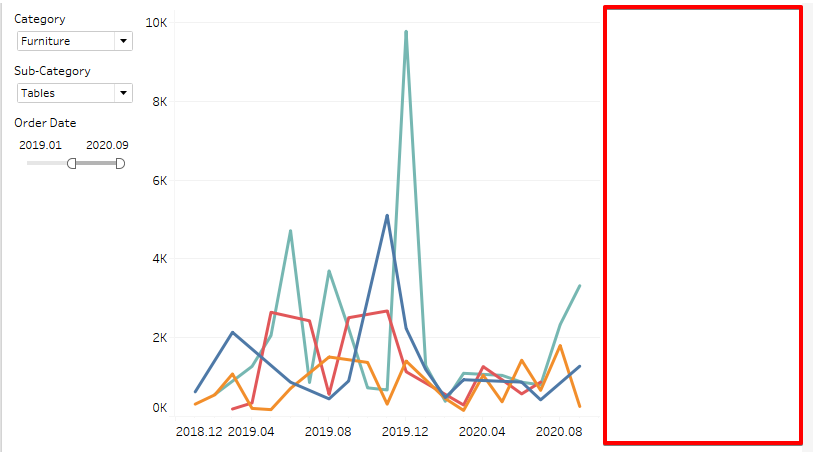
At this stage, you nearly get the view you want. There is only one problem: when you change the max date of the date filter, i.e: from 2020.12 to 2020.09, Ops! The ranking part disappears.
The reason is how you set the Top Date filter and Date range filter of Order Date. If you want Tableau to get the Max Date of whatever the date range you chosed, you must set the Order Date range filter as Context Filter and the Top date filter as normal filter.
Also, if not all the category or sub category have the same order date range, you need to put Category and Sub Category in to Context filter too.
Then you are all done!

This option is simple and easy to follow but you may face some difficulties in setting the filter options (all value in data base or Only relevant value) when building your dashboard. So I have another better option.
By using FIXED {}, you don’t have to worry about the Context filter or normal filter anymore. Just create a Max(Sales) calculated field like below:
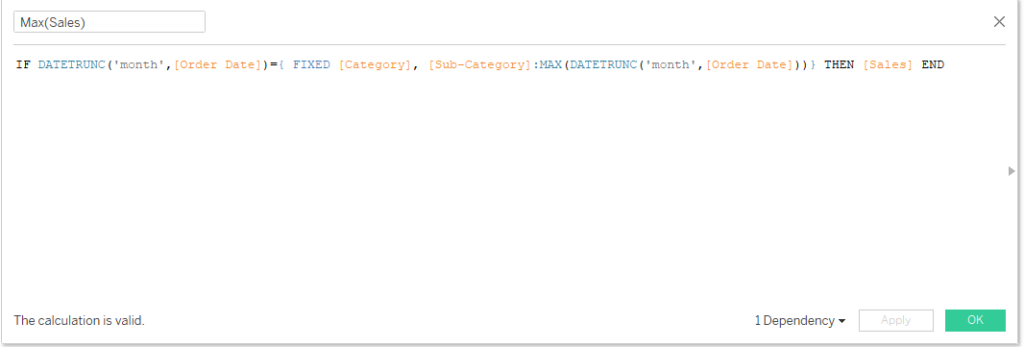
Then add new sheets for color block and latest figure ranking, using MAX(Sales) and descending sorted by MAX(Sales). Finnally, add the Order date into Context Filter.
That’s all, you got what you want!
Using LOD may make your workbook heavier and take more query time so you should consider which option is suitable for your current workbook.
